Evidence over promises

What Better Business Operations Can Look Like.

Every engagement starts with a business problem. The outcome is measured in the operating reality that changes after the work.

Start With Diagnosis
PROBLEM
→ OUTCOME
Illustrative examples

Examples of How Improvement Can Be Measured.

These scenarios are illustrative until each metric is confirmed by the content owner as a permissioned and defensible client outcome.

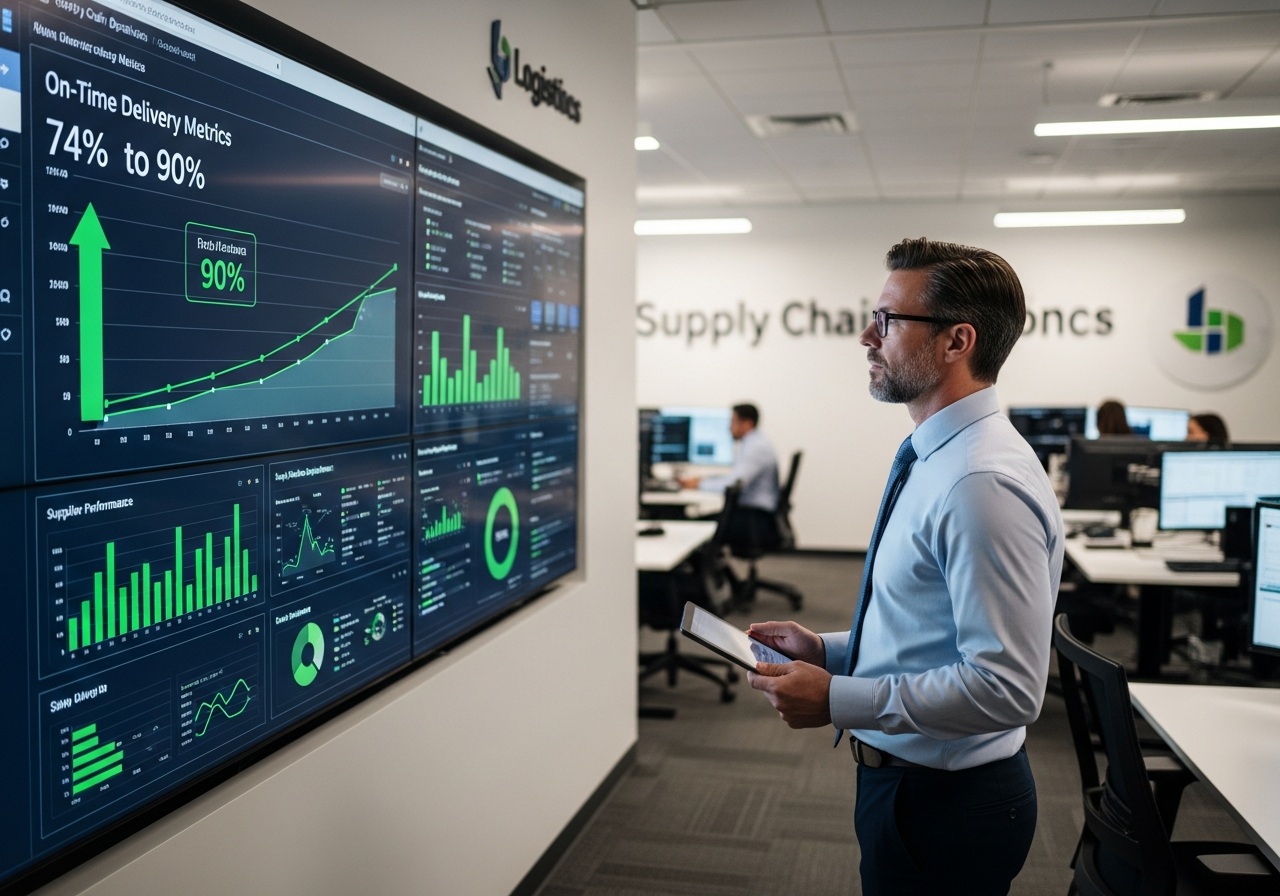
Supplier performance review dashboard
Illustrative Example
+16%
On-time supplier delivery

Manufacturing scenario

A fragmented supplier performance process is mapped from purchase order to goods receipt. Informal exception types become one standardised workflow with clear escalation triggers and SLA checkpoints.

Illustrated outcome: improved delivery performance using a lightweight tracking layer on the existing ERP.

Organised warehouse inventory
Illustrative Example
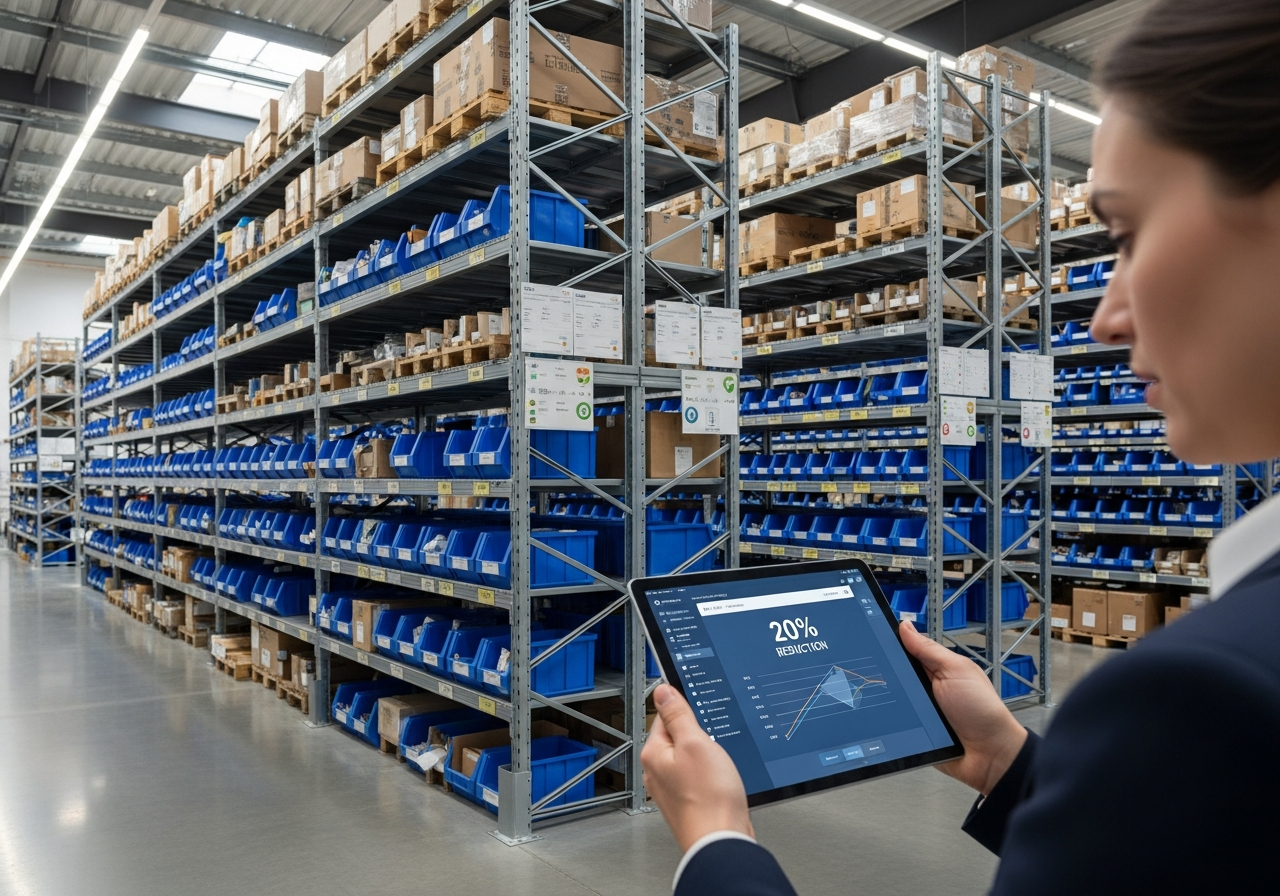
−20%
Service spare parts inventory

Industrial services scenario

The spare-parts catalogue is classified by criticality, failure frequency and lead time. Reorder logic becomes a structured replenishment policy.

Illustrated outcome: working capital released without sacrificing service.

Productivity metrics dashboard
Illustrative Example
$100K
Annualised productivity benefit

Professional services scenario

Repetitive administrative processes are documented before automation. Existing tools are used only after inputs, rules, exceptions and outputs are clear.

Illustrated outcome: targeted automation creates an annualised productivity benefit.

What we measure

The deliverable is not the outcome. The outcome is what the business can now see, decide and do better.

Discuss Your Outcome